Isabel Robertson and Emily Weiler
Whitworth University

Method
The who, what, where, and how...
Participants
Who: Undergraduate students from Whitworth University
How many: 70 total
18 responses removed for incompletion or age restriction
52 sets of data used for analysis (28 female, 24 male)
Age: 18-25
Ethnicity:
CONSENT: Participants were required to read about and consent to participation before the online activity
Variables and Materials

Independent Variable: NON-VERBAL COMMUNICATION
Two categories
1. Posture Cues
2. Hand Gesture Cues
All participants received each of the categories of the independent variable, and every image within each category, for a total of 10 images.

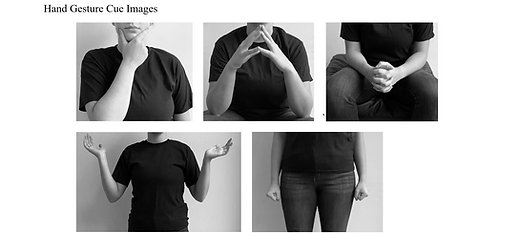
What they did: Participants observed ten black and white images, five images of posture cues and five images of hand gesture cues (see to the left).
With each image, participants were asked to imagine an individual who was demonstrating each of the displayed cues and determine how the cues alone made them think about that imagined individual and their character.
Choice of materials:
These cues were chosen for their general use in daily life. The images were self-generated and modeled. Little research could be found that investigated such cue categories, so this self-generated assessment was created to fill that gap.
Dependent Variable: TRAIT ATTRIBUTION
-Trait attribution was measure on 3 personality trait Likert Scales
-Traits chosen: Agreeableness, Sociability (a word substitute for extraversion) and Emotional Stability
-Following each cue image, participants were presented with the following activity
- Trait attribution was measured using the presented question “how (agreeable, sociable, or emotionally stable) do you believe a person exhibiting this (posture or hand gesture) would be?” after which participants were asked to rate each image on the three provided scales.
-The rating provided by the participant determined whether the trait was positively attributed to the image (score of 4 or 5 on the scale), negatively attributed (score of 1 or 2) or neutral (score of 3).
Demographics and End of Survey:
Following the 10 images and scale rating activities...
1. Participants answered 3 questions about their personal demographics (age, gender and ethnicity)
2. Received an end of survey message, that could be photographed for proof of participation for students looking to receive credit for class.
